



How I debugged and fixed a memory leak in my Node.js dev server
For some time, working on devtools.tech locally was getting worse. I would start the dev server, work for a while, and then pages stopped loading. When I checked the browser devtools, the page asked for a script like /build/routes/questions-XYZ.js. Rather than sending it, the server redirected the browser to our 404 page (a 302 to /404). After a while, the dev server in the terminal died with JavaScript heap out of memory. So I had to restart the dev server again and again.
I had already raised V8's heap limit to 8 GB with --max-old-space-size=8192. That only delayed the crash. The server still died every time. So I decided to investigate and fix it once and for all. This post covers what I learned along the way, and a method you can use on any Node process that leaks.
Measuring the leak
The first step of debugging is measuring. You can't vibe-fix a leak without knowing the numbers. So I started the dev server and requested the same page 15 times, printing memory after each request:
for i in $(seq 1 15); do
  curl -s -o /dev/null localhost:6000/learn/how-the-browser-runs-your-code
  echo "req $i rss=$(ps -o rss= -p $PID | awk '{printf "%d MB", $1/1024}')"
done
req 1  rss=1079 MB
req 2  rss=1260 MB
req 3  rss=1436 MB
...
req 15 rss=3015 MB
Notice that memory grows by about 140 MB per request on average. This request only returns a redirect, so 140 MB is a red flag. At this rate, the server reaches its 8 GB heap limit after around 50 requests. (RSS counts more than the heap, but it's close enough to see the trend.) One page load in the app makes several requests (the document, loaders, fetchers), so the server lasts only a few minutes of normal use.
Checking memory on macOS
While I was investigating, the server's RSS (Resident set size) suddenly dropped from 2.4 GB to 56 MB. RSS is the memory a process has in RAM right now. Had the server freed everything? No. My analysis scripts needed RAM, so macOS compressed the server's memory. Compressed pages don't count towards RSS.
So if you're on macOS, check the physical footprint instead:
vmmap --summary $PID | grep "Physical footprint"
# Physical footprint: 2.8G
Still 2.8 GB. Nothing had been freed.
Reading the dev server's code
devtools.tech runs on an earlier version of Remix with the original remix dev. Its server code is in node_modules/@remix-run/dev/dist/devServer/serve.js, and the very first middleware explains a lot:
app.use((_, __, next) => {
  purgeAppRequireCache(config.serverBuildPath);
  next();
});
Node keeps every file it loads in require.cache. When you require() the same file again, Node returns the copy it already has instead of loading the file again. That's fast, but your code changes don't appear until you restart the server.
The dev server avoids the restart. Before every request, it deletes the build from require.cache, then calls require() again. So Node reads and runs the whole build from scratch. You see your latest code without restarting, but every single request loads a fresh copy of the build.
How big is that build? Let's find out using the following command.
ls -la build/index.js
# 20154561 build/index.js
20 MB. My remix.config.js had serverDependenciesToBundle: "all", so every dependency (Sentry, Amplitude, Mantine, CodeMirror, all of it) went into that one file. Every request ran all of that code again.
Running 20 MB of code on every request is slow, but slow isn't a leak. A leak is memory the process never frees.
Node frees memory with a garbage collector (GC). The GC regularly looks for objects that nothing holds a reference to (no variable, property or closure points to them) and frees them. So once the dev server deletes the old build from require.cache, the old copy is garbage, as long as nothing else still holds a reference to it.
Here, something did. Memory kept growing, so something was still holding a reference to every old copy.
Side note: Learn how Garbage Collector works in JavaScript here.
Reproducing the leak in a small script
A dev server has too many moving parts to debug directly. So I copied what it does into a small script. The script loads the build, removes it from the cache, loads it again and forces a GC each time:
// leak.js: run with node --expose-gc leak.js
// (--expose-gc lets the script call global.gc() to force a GC)
const path = require("path");
const build = path.resolve("build");

// Heap memory in use right now, in MB.
const mb = () => Math.round(process.memoryUsage().heapUsed / 1048576);

for (let i = 1; i <= 6; i++) {
  // Do what the dev server does: remove every build file from the cache.
  for (const key of Object.keys(require.cache)) {
    if (key.startsWith(build)) delete require.cache[key];
  }

  // The build is gone from the cache, so Node loads a fresh copy.
  require(build);

  // Free everything that nothing holds a reference to.
  global.gc();

  // If old copies were freed, this number stays flat.
  console.log(`load ${i}: heap ${mb()} MB`);
}
load 1: heap 193 MB
load 2: heap 323 MB
load 3: heap 453 MB
load 4: heap 583 MB
load 5: heap 713 MB
load 6: heap 844 MB
Every load adds 130 MB, and even a forced GC can't free it. That's the leak. Now I could reproduce it in one second, without a browser.
What I tried first
My first guesses were the usual things that keep old code alive in Node. For each one, I removed it between loads and reloaded the build four times. If the guess was right, memory would stay flat. If not, it would grow by 520 MB (4 × 130 MB).
Globals. Globals live as long as the process, so anything the build puts there stays. The build added these:
__SENTRY__, onerror, onunhandledrejection, regeneratorRuntime, __core-js_shared__, Symbol(ͼ)
I deleted all of them between loads. Memory still grew by 520 MB.
module.children. When a file calls require(), Node also adds the loaded module to that file's module.children list. Clearing require.cache doesn't touch that list, so the old copy stays in it. I cleared the list too. Still 520 MB.
Process hooks. Some libraries replace functions that the whole process shares. The build had replaced console.log, console.error and Error.prepareStackTrace. It had also added uncaughtException listeners. I put all of them back between loads. Still 520 MB.
Getting the exact same number three times was the clue. Several references held each old copy. Removing one or two changed nothing, because any reference that's left keeps the copy alive.
Finding the leak with a heap snapshot
Guessing wasn't working, so I took a heap snapshot instead. A heap snapshot is a file that lists every object in memory and what points to each one. So if an old copy of the build was still in memory, the snapshot could show me what was holding it.
The hard part is finding one old copy among millions of objects. So before reloading, I attached an object of my own class to the first copy. Nothing else uses that class, so it's easy to search for:
const v8 = require("v8");
class LeakMarker {}

// Load the first copy and tag it.
require(build);
require.cache[build + "/index.js"].exports.__marker = new LeakMarker();

// ...remove it from the cache and load a second copy...

// Free everything that can be freed, then save the snapshot.
global.gc();
v8.writeHeapSnapshot("heap.heapsnapshot");
If the old copy had been freed, the LeakMarker wouldn't be in the snapshot. It was still there. So I wrote a small script that starts from the objects that always stay in memory, such as global, and finds the shortest chain of references to the marker. (Chrome DevTools can also open heap snapshots, in the Memory panel. The appendix at the end shows how my script works.)
Here's what was holding the old copy, simplified:
global.onerror
  → an error handler from the old copy
  → the old copy's module
  → LeakMarker
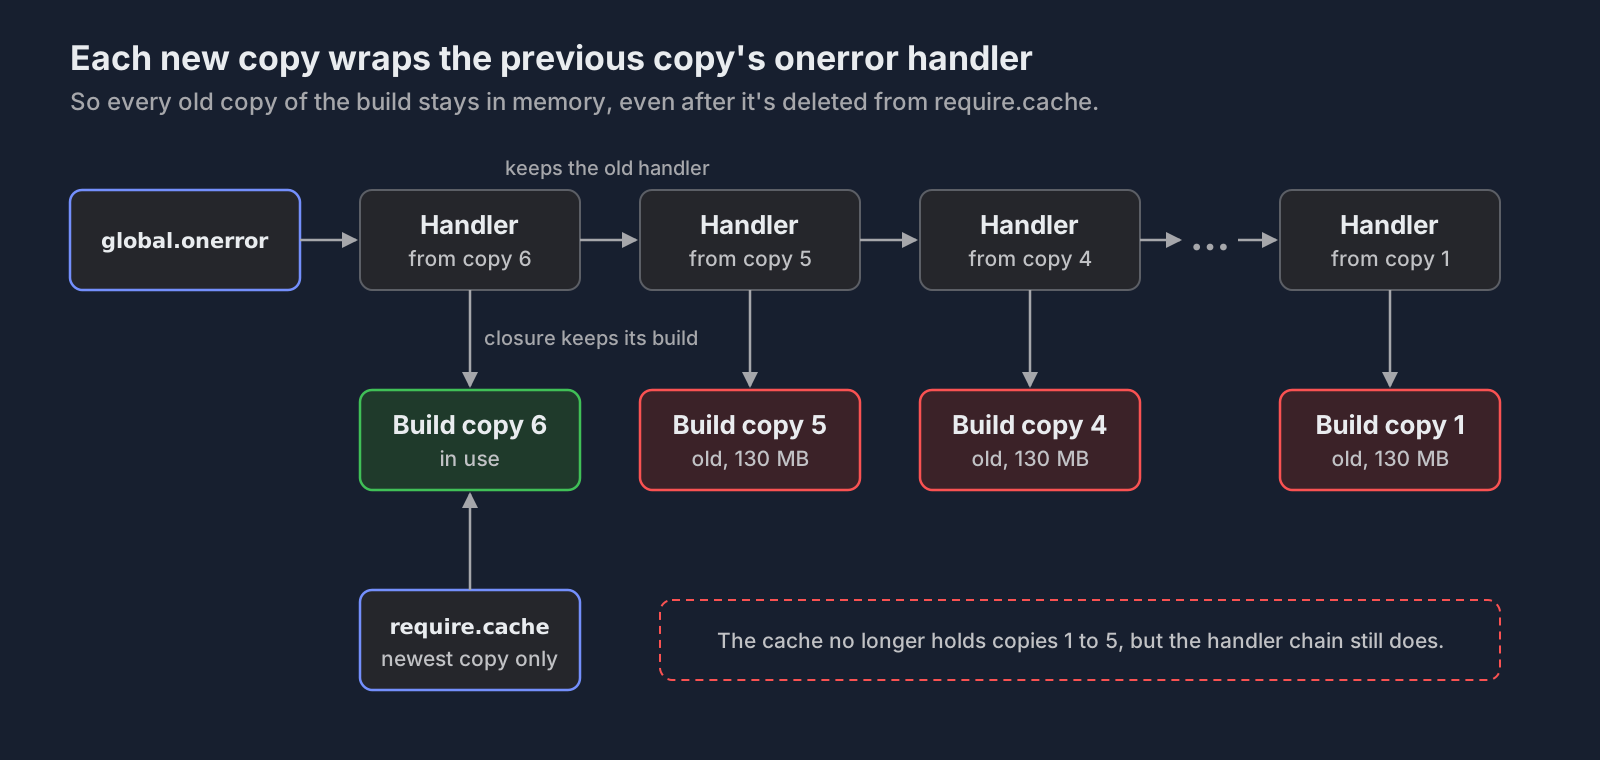
A function keeps the variables from the place it was created. This error handler was created inside the old copy, so it keeps that whole copy alive, all 130 MB of it. And global.onerror lives as long as the process does.
Who sets onerror? I searched the build and found Sentry:
// node_modules/@sentry/utils/cjs/instrument/globalError.js
_oldOnErrorHandler = GLOBAL_OBJ.onerror;
GLOBAL_OBJ.onerror = function (msg, url, line, column, error) {
  // ...report the error, then call _oldOnErrorHandler
};
Sentry saves whatever onerror was there before, then sets its own handler that calls the old one. That's fine when it runs once. Here it ran on every request, so each new copy wrapped the previous copy's handler. Each copy held a reference to the one before it, all the way back to the first. That's also why deleting the global earlier didn't help: other references still held the copies.
I reset onerror and took another snapshot. The old copy was still there. This time process.emit was holding it, because a library called source-map-support had wrapped it:
// source-map-support, bundled into the build
function shimEmitUncaughtException() {
  var origEmit = process.emit;
  process.emit = function (type) {
    // ...
    return origEmit.apply(this, arguments);
  };
}
It's the same pattern: save the existing function, replace it with a wrapper and keep the old one. process lives as long as the server, so every wrapper stays, and so does the old copy each wrapper came from.
At this point I stopped. I had found two retainers: things that hold a reference and keep an old copy alive. More were clearly behind them, because every bundled library that wraps a process-wide function adds another one. Removing them one at a time would never end.
What caused the leak
Sentry and source-map-support aren't buggy. They expect to run once, when the server starts. The dev server ran them again on every request, inside the same process. Each run wrapped something the whole process shares, like global.onerror or process.emit, and kept a reference to the old one. So every old copy of the build stayed in memory.
Reloading code isn't a leak on its own. It leaks when the code changes something shared and never undoes the change. Bundling every dependency made it worse, because dozens of libraries like these reloaded on every request.
So clearing require.cache removes only the cache's reference to a module. If anything else still points to the module, it stays in memory.
Why the 302s happened
This also explained the 302s. Every time I saved a file, the old dev server rebuilt the app. Each rebuild starts by emptying public/build, the folder the browser loads scripts from:
onBuildStart() {
  clean(config); // fse.emptyDirSync(config.assetsBuildDirectory)
  // ...
}
So while the build was running, the browser asked for scripts that weren't there yet. If the build failed, they stayed missing. Express didn't find the file, so the request reached the app's catch-all route (the route for any URL that no other route handles). That route redirected it to /404.
Worse, every one of those requests also reloaded the 20 MB build, because the dev server does that on every request. A page with 30 scripts could add about 4 GB at once. So the 302s and the crash had the same cause.
The fix
I changed the setup to restart the server process instead of reloading code inside it. A new process starts with empty memory, so nothing from an old copy is left.
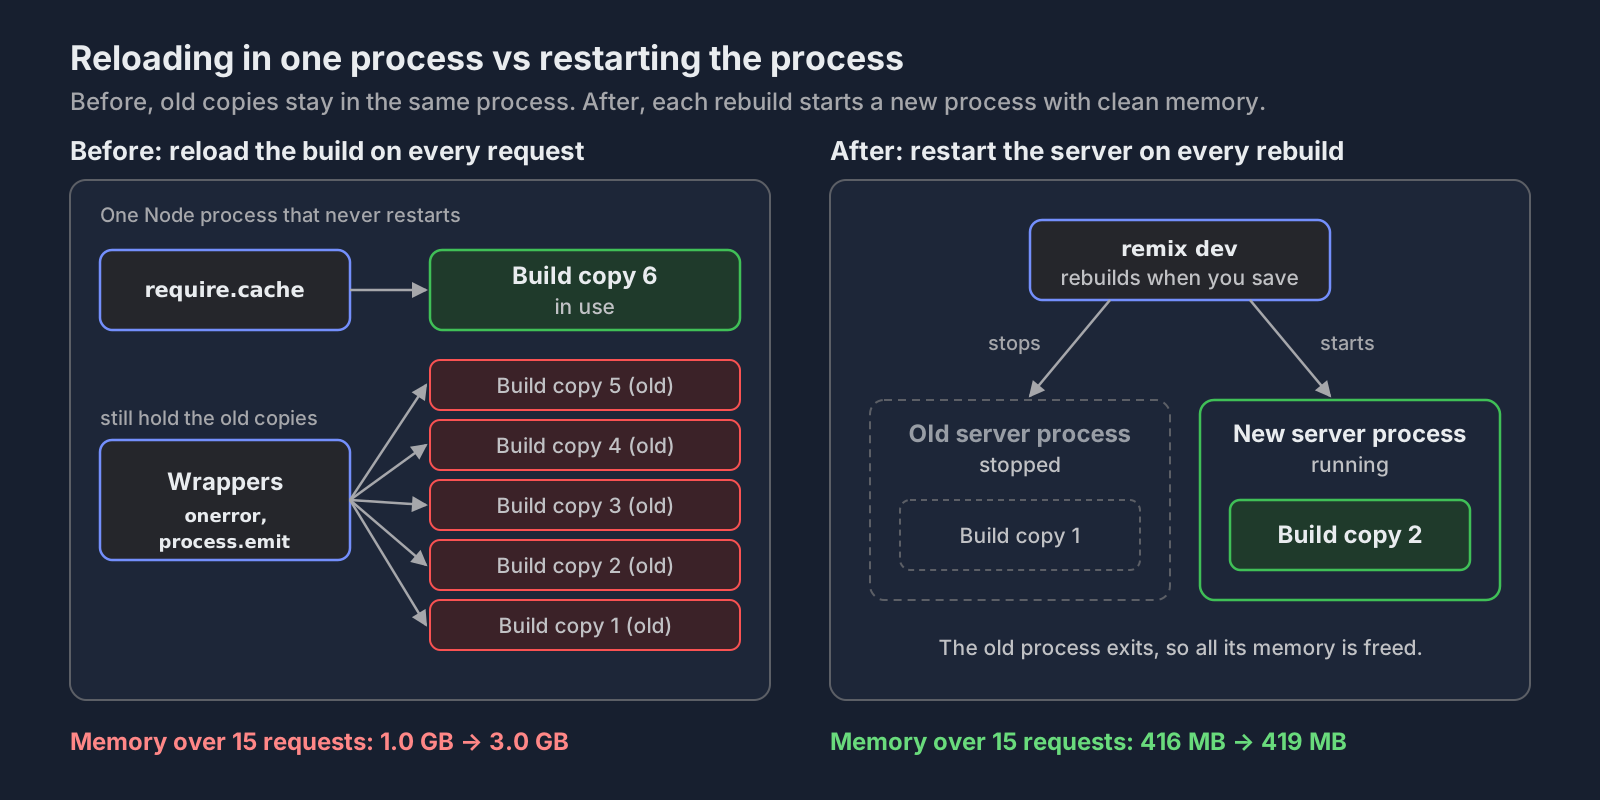
My Remix version already had this behind a future flag (an opt-in setting) called v2_dev. With it, remix dev runs my server as a separate process and restarts it after every rebuild:
// remix.config.js
module.exports = {
  // ...
  future: {
    v2_dev: true,
  },
};
"dev": "remix dev -c \"node server.js\""
My server.js already loaded the build once at startup, which is exactly what this setup needs. It only had to tell the dev server when it was ready:
const { broadcastDevReady } = require("@remix-run/node");
const build = require("./build");

app.listen(port, () => {
  if (process.env.NODE_ENV === "development") {
    // Tell remix dev the new server is up, so it can update the browser.
    broadcastDevReady(build);
  }
});
The Remix docs show the full setup in With a custom app server.
For the 302s, I made sure a missing script gets a 404 and never reaches the app. One extra middleware after the static files does that:
app.use(
  "/build",
  express.static(path.join(__dirname, "public/build"), {
    immutable: true,
    maxAge: "1y",
  }),
);

// A missing build file is a 404, not a page.
app.use("/build", (req, res) => res.sendStatus(404));
This helps in production too. After a deploy, someone with an old page open can ask for scripts that no longer exist. A quick 404 is much cheaper than rendering the whole app just to redirect them.
A build error with JSX in .js files
The first build with v2_dev failed:
✘ [ERROR] Expected ">" but found "size"
      20 │     icon: <IconCheck size="1.1rem" />,
v2_dev also turns on hot module replacement (HMR), which updates the open page without a full reload. For HMR, my Remix version decides how to read each file from its name. A name ending in x (.jsx, .tsx) can contain JSX. Any other name is read as plain TypeScript, which can't. Two of my .js files had JSX in them, so I renamed them to .jsx, and the build worked.
Results
I ran the same test as at the start: 15 requests to the same page.
| Before | After | |
|---|---|---|
| Memory over 15 requests | 1.0 GB → 3.0 GB | 416 MB → 419 MB |
| Time per request | 0.48 s | 0.15 s |
| A missing script | 302, plus a full build reload | 404 in 2 ms |
Memory now stays flat. Requests are also about three times faster, because they no longer reload the 20 MB build.
I also rebuilt five times. Each time, a fresh server started at about 415 MB and was ready in about 1.5 seconds. Every asset loaded with a 200, so no more 302s. HMR updated the open page without a reload.
Takeaways
If you're debugging a leak in Node, here's what I'd take from this:
- Measure first, and measure the right number. On macOS, RSS can drop while the memory is still in use, so check the physical footprint.
- Reproduce the leak in a small script. Ten lines that leak in a second beat an hour of testing in the browser.
- Use a heap snapshot to find what holds the memory. Tag the object you expect to be freed, then search the snapshot for what points to it. Ignore anything that comes from your test script.
- If removing something changes nothing, something else still holds the memory. Often several things do.
- Be careful when you reload code in a process that keeps running. Libraries that wrap
process,global,consoleorErrorexpect to run once. If they run again, each new wrapper keeps the old copy alive. Here, restarting the process was the simpler and safer fix. - Missing static files must return a quick 404. Never let them reach your app's catch-all route.
Appendix: searching a large heap snapshot
The script searches from the GC roots: the objects V8 always keeps, such as the global object and the stack. Anything the GC can reach from a root stays in memory. So the shortest chain of references from a root to the marker is exactly what keeps the marker alive.
The snapshot was 578 MB. Reading it with JSON.parse(fs.readFileSync(...)) fails right away:
Error: Cannot create a string longer than 0x1fffffe8 characters
A Node string can be at most about 512 MB, so the file doesn't fit in one string. I read it as a Buffer instead and parsed its three big lists directly: nodes (the objects), edges (the references between them) and strings (their names). The number lists were also too big for a normal array, so I stored them in growable Uint32Arrays.
The search walks the references outward from the GC roots, one step at a time (a breadth-first search). It skips weak references, because a weak reference doesn't stop the GC from freeing an object. So the first chain that reaches the marker is the shortest one:
// parent[n] is the object we came from to reach object n. -1 means not reached yet.
const parent = new Int32Array(nodeCount).fill(-1);
parent[0] = 0; // object 0 is the snapshot's root
const queue = [0];

for (let head = 0; head < queue.length; head++) {
  const node = queue[head];
  for (const edge of edgesOf(node)) {
    // A weak reference doesn't keep anything alive.
    if (edge.type === "weak") continue;
    // First time we reach this object: remember how we got here.
    if (parent[edge.to] === -1) {
      parent[edge.to] = node;
      queue.push(edge.to);
    }
  }
}
// Follow parent[] back from the marker to print the chain.
Watch out for your own test script. My first chains went through its module.children, a pending microtask and its stack. So I fixed the script, waited for async work to finish and skipped chains that start from the stack, because the real server's stack looks nothing like my test's.
Here's the full chain my script printed. Each line is an object, and each arrow is a reference to the next one:
(GC roots)
  --> (Global handles)
  --> global
  --[onerror]--> (closure)
  --> Context
  --[require]--> (closure) require
  --> Context
  --[mod]--> Module
  --[exports]--> Object
  --[__marker]--> LeakMarker
(closure) is the error handler. Context is where a function keeps the variables from the place it was created. The handler's context holds require, the function Node gives every file. That require points to the old copy's Module, which holds its exports, and the marker sits on the exports.
